

Utilizing Support and Resistance Levels
Part 3 of 4: Applying moving averages to identify support and resistance levels.
By Toni Hansen
Over the past month I have been introducing you to some of the key aspects of using support and resistance levels in your market analysis and hence your trading. My first class in this series dealt with a basic introduction to support and resistance and using pure price support and resistance levels in your trading. In my second class we took price support and resistance a step further by applying trend lines and trend channels. In today's session, for the first time, we will be looking at another type of support and resistance which is based upon price, but which falls into the category of an indicator.Indicators are the visual representation of mathematical calculations based upon price or volume activity. The indicators I will be covering today are very basic ones, which are used by a large percentage of the trading populace: moving averages. As those of you who know my style are aware of, I am not overly fond of indicators in general. Most of my trade decisions are based primarily upon price and volume activity. There are a lot of popular forms of indicators that traders use for support and resistance. The problem is that it can be very easy to rely to heavily upon the indicators and ignore those underlying price clues. One of the few indicators I have ever used in my life are moving averages.
Moving averages are lines drawn on your chart, typically by your charting platform (unless you live in some archaic world and are actually plotting your moving averages by hand). They are visual representations of the calculation of average price movement in a given period of time. For instance, a 20 day simple period moving average measures the average price of the past 20 days and marks that point on your current daily chart. Most moving averages are based upon the closing price of the time frame used. So, in this case, it would mean the closing prices of the past 20 days. In the case of a 5 minute 20 period simple moving average it would mean the past 20 5 minute bars. It is called a "moving" average because the calculations are being constantly adjusted and plotted as prices develop.
Traders tend to stick to two main forms of moving averages: simple moving averages (such as those mentioned above) and exponential moving averages. Some traders get more fancy than these alone, but let's not stray too far off the beaten path. Simple moving averages (aka arithmetic moving averages) are calculated by adding those closing prices for that given span of time and then dividing this total by the number of time periods (i.e. the 20 days). Exponential moving averages are similar but they give more weight to the most recent data.
I've always used simple moving averages myself. They have suited me well and for that reason alone I've never had the desire to try anything else. "If it's not broken, don't fix it," is the saying that aptly applies here. Many professionals of my acquaintance use only exponential moving averages and swear by them though, so it's somewhat in the eye of the beholder. The main thing is to avoid flipping back and forth once you've picked a side.
There are many time periods used for measuring moving averages. Once again I fall back on the most common. These are the 10, 20, 50, 100 and 200 period simple moving averages. Intraday, however, I don't ever display anything other than the 20 and 200 on my charts. I've just found these two to be the most influential on that time frame. These days I do not even have moving averages on many of my charts anymore since I use price action to show me the support and resistance levels, but for those who are struggling to get a grasp on where prices are likely to stall or reverse, they are extremely useful as visual clues.
Like any indicator, however, you cannot rely on a moving average alone to tell you prices will stall or reverse. It is just one tool you should be using. It is more powerful when combined with other forms of support and resistance and it's also more powerful when pace, volume, trend placement and correction periods are interacting in a positive manner at the time the moving average hits. You can learn more about these in my CD course at http://www.swingtrader.net, which covers all of these topics in detail.
One thing to remember, which I covered in the previous classes, is that all types of support or resistance are merely price zones. While a moving average may have one exact price at any given time, it is not that perfect price that typically matters, but rather the zone of that price. Think of it as having some cushion to it. Moving averages often have more cushion than the other forms of price support and resistance because every charting platform tends to differ slightly in their calculation of what the moving average is. It tends to be very dangerous to use moving averages for stops and trailing stops as a result, since it is very easy to miscalculate just how much cushion you should give it.
It could be argued that the reasons moving averages work so well as support and resistance levels are because they are followed so widely and hence have a lot of the self-fulfillment characteristic to them. For whatever reason, however, the fact remains that they do. Please take a look at Figure 1 of the QQQQ. This chart displays the most widely followed moving averages and how they serve as both support and resistance. Throughout the entire uptrend in the QQQQ, each of these moving average levels stalled the price action for at least several days. In most instances the prices then congested following the test of the moving average, bouncing around in the zone of the moving average before breaking higher. Once each moving average level broke, it then became support. The most notable ones are the 10 and 20 day simple moving averages.
FIGURE 1 - Major Moving Averages
http://www.tonihansen.com/classes/SR_MA1.gif

Figure 2 shows a close-up of the beginning of the price action from the previous chart. When support and resistance levels hit for the first time, that is when they are often the most powerful. In the case of moving averages, when you look at a daily time frame for instance, the first day each of these major moving averages hit held the resistance zone of the moving average almost exactly. When I am taking a position intraday, I almost always look to see where the major moving average price levels are on that daily time frame, because I know how difficult it will be to break through them the first day they are tested. Keep in mind, however, that at time a daily moving average may strike intraday, correct for a few hours intraday, and then still break, or, with enough momentum, break anyway. So, while this is a good tip to keep in mind, like all tools, it does not work each and every time.
FIGURE 2 - First Test of Moving Average
http://www.tonihansen.com/classes/SR_MA_1stTest1.gif

One of the things moving averages are used for is to identify trends and to assist in calculating pullback levels within a trend. Figure 3 shows a typical uptrend on the daily chart of the QQQQ. While the QQQQ spent a great deal of time hanging out at the 10 day simple moving average, it was the 20 day simple moving average that served as the larger support for the trend as a whole. Prices did puncture the moving average to some degree at each test of that support zone, but the zone itself held. Most trends will use the 20 period simple moving average for support, but stronger momentum may hold only a 10 sma, whereas a slower trend may use the 50 sma.
FIGURE 3 - Moving Averages and Trends
http://www.tonihansen.com/classes/SR_MA_Trend.gif

When a trend is not clear, as in a sideways congestion zone, then moving averages tend to loose some of their power. Figure 4 shows such an example. The 20 period simple moving average held for the most part when tested on the first day of a price move, but instead of causing a reversal, the moving average gave way fairly quickly in successive sessions.
FIGURE 4 - Moving Averages and Trading Ranges #1
http://www.tonihansen.com/classes/SR_MA_range1.gif

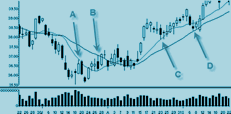
Another example of this can be seen in Figure 5 where the NQ has struck the 5 minute 20 period simple moving average on numerous occasions, but up until the very last test of it in "D" it managed to break through the support and resistance formed by the moving average within about 15 to 20 minutes. At "D" the prices began to congest at the upper end of the channel and based sideways while the moving average caught up to the prices instead of the moving average hitting as a result of a pullback or bounce into it. The result was that it eventually gave way to a breakout higher.
FIGURE 5 - Moving Averages and Trading Ranges #2
http://www.tonihansen.com/classes/SR_MA_range2.gif

In the examples of the trading ranges, you may have noticed that many times the moving average was tested for several bars in a row before breaking through the moving average. When a moving average does this, it can be considered to be "hugging" the moving average. This means that is it tested on multiple occasions without really bouncing or falling off it to any large extent. An example of this on a larger scale is shown in Figure 6. I love to see this type of price action, because it often indicates that the support or resistance is weakening and eventually will break through it. There is a time factor that must be considered, but in and of itself, this is a wonderful concept to watch for. Figure 6 shows example of it as both a short setup in October as a minor break and then a major break into early November, as well as the more obvious buy setup in late November.
FIGURE 6 - Prices Hugging Moving Averages
http://www.tonihansen.com/classes/SR_MA_hugging1.gif

I hope that you have enjoyed this class! On January 17th I will be covering yet another form of indicator support and resistance: Fibonacci levels. For those of you whom are futures traders, you may find that class to be particularly helpful.
All my best,
Toni
Click here to view Part 4.
Follow us on:


Testimonials for Toni Hansen
"Dear Toni, I want to thank you for sharing the knowledge and insights you have gained over the years as a professional trader. I would recommend your CD and mentoring to anyone serious about consistently making money in the market, regardless of market conditions. As an experienced investor who has watched you firsthand, it is clear that you are a world class trader. Thanks for helping me become a better trader." - Guy Allen, Florida
“I owe you so much when it comes to my development as a trader. You have been a guiding light... I will always look back on you as a key element in that success. Thank you so very much...” - Greg
“Anyone who is trading needs your guidance for the education of trading. Your education of trading aspects is the GREATEST thing I have ever used. I learned more in two weeks from you, than from any books I read. THANKS AGAIN!” - Clarence E. Austin
“I'm done for the day and am very pleased...I have taken all your calls and follow them to the T...the NQ ones that is (trade QQQQ) and I play the gaps in the morning also (I'll take the 71% chance anytime)...I have turned myself around...First time in months...Thank-you! ”- Richard Widen
“I hope that everyone truly understands just how fundamentally sound and accurate your market trading strategies and concepts are. I have been trading for quite some time, and I just want you to know that I have been so very impressed with your substance based upon sound trading fundamentals and not "fluff" THANK YOU...” - Randall Morrow